

Guides and fly shops routinely spit out numbers from stream gauges, often expecting you to react with pure delight or sheer terror when you hear them. The fact is, unless you spend a lot of time on the water as an angler, paddler or other related water bum, those numbers won’t make a lot of sense to you. Most folks would probably just like to know whether or not they can go fishing. But the better you understand these numbers, the better decision you’ll be able to make on if to go, where to go and what to expect when you get there.
Stream Gauge Basics
There are a lot of things about reading these gauges that are extremely simple while other aspects can get a bit complex. Many things regarding how water flow is going to impact a stream, you just have to see for yourself to truly understand. Then you can relate that to a gauge number and get a pretty good idea of what that water will look like before you leave the house.
Before these gauge readings were posted on the internet, you had to just make your best guess and/or drive to the river to see if it was going to be too high to fish. Even now, with these numbers so easily accessible, there will sometimes be some guesswork, but at least it’s a much more educated guess!
Accessing Stream Gauge Info
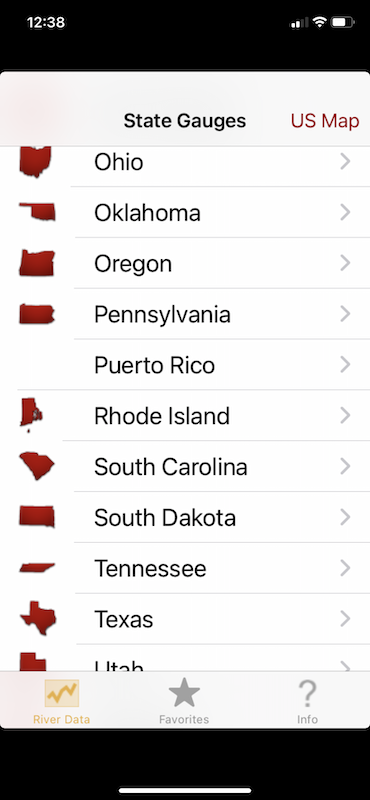
The USGS has stations all over the country and there are a number of different search features to locate the gauge on or nearest the fishery in which you’re interested. Many larger rivers will have multiple stations spread out on different parts of the river. You can, of course, use a search engine to locate a specific place. Or go to usgs.gov and begin your search there. There are also a number of apps that can be downloaded. They make searching for a particular location much simpler and keep that information right in your pocket. I use an app called RiverData that gives you access to any river gauge in the country.
Stream Gauge Locations
It’s important to note that not every stream has a gauge. So, you sometimes have to rely on the closest gauge to your fishery and assume that both water systems received similar weather. For example, if I’m going to fish Deep Creek in the Smokies, the nearest gauge is on the Oconaluftee. Most of the time, Deep Creek is going to get the same or similar rain events as the Oconaluftee… but not always.
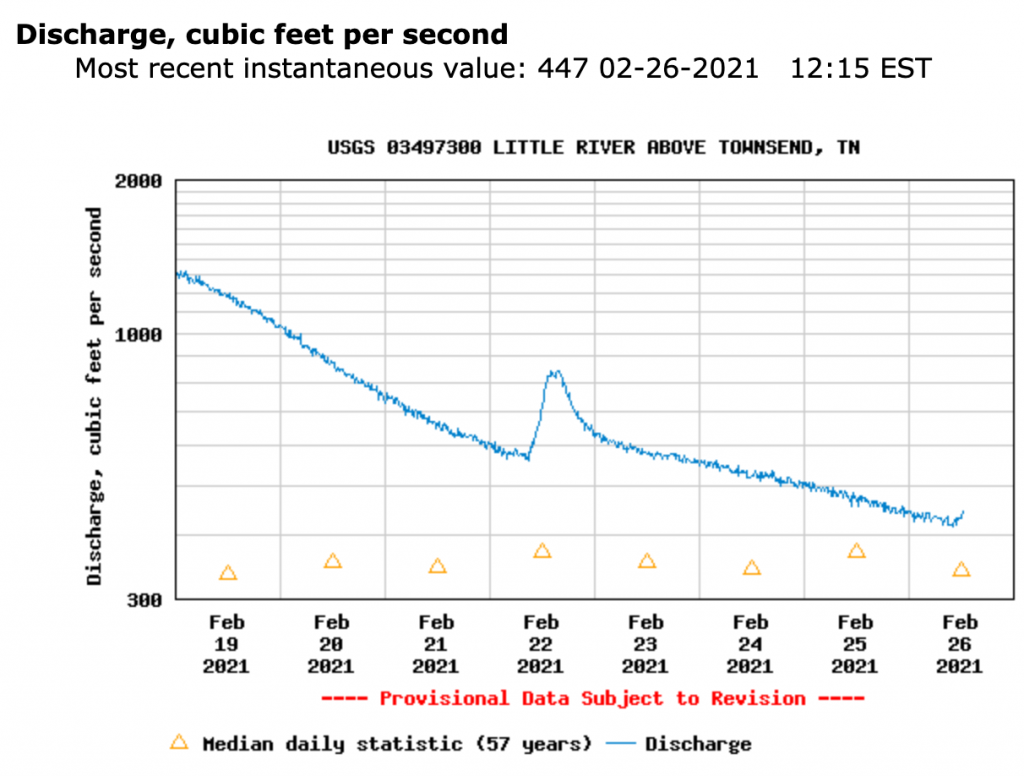
And even when you have a gauge on the stream you’re specifically interested in, isolated weather systems will sometimes skew the data. For instance, Little River has a gauge located in Townsend, below the confluence of the three prongs. So, if the water rises on any of those prongs, it will ultimately impact the numbers on the gauge downstream in Townsend. Usually if the gauge numbers are reading high in Townsend, the water will be up on all three prongs as they are close enough together that they typically receive similar weather. However, there have been occasions when there was an isolated heavy rain on East Prong that only raised water levels on that branch. Of course, the downstream gauge in Townsend reflected that spike but the West Prong didn’t come up at all.
Unless you’re closely tracking every weather system, there’s just no way to account for something like that. Stream gauges are wonderful tools for determining water levels before you make the trip to the river. But without multiple stream gauges spread out on different sections of every stream in a watershed, you will often, to some extent, be making decisions based on probability rather than 100% certainty.
Understanding Stream Gauge Tools
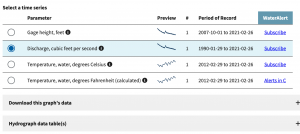
Not every gauge provides the same information. Some will provide a cubic feet per second (cfs) reading, some will provide a height reading (usually measured in feet), some will include a temperature reading and many have all three. A handful will get even more in the weeds and provide things like dissolved oxygen readings. For real water flow nerds, most will also allow you view charts in weekly, monthly and annual views. As long as a gauge has been in a location for forty years, I can probably look up what the flow was in that location forty years ago!
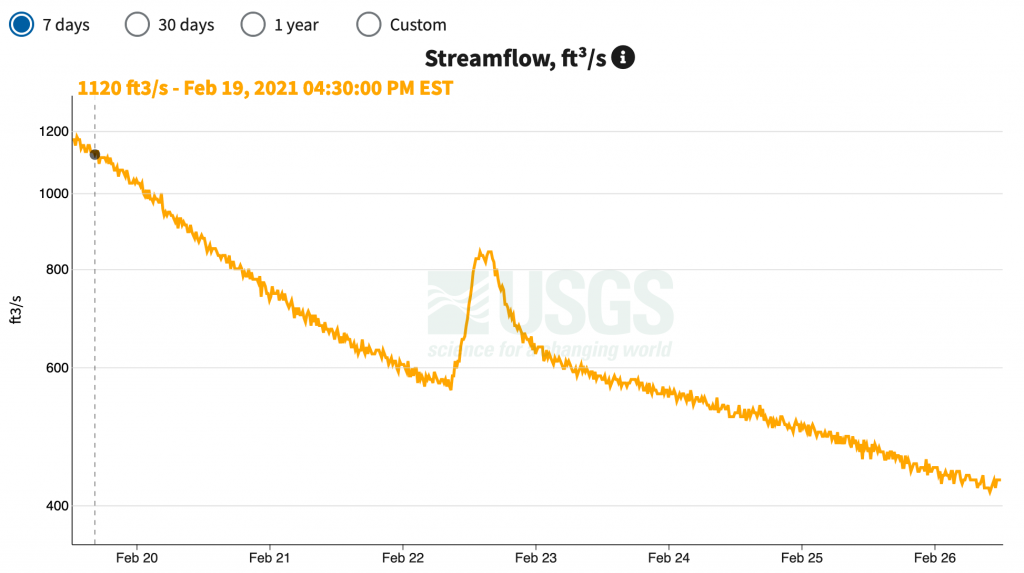
It’s also worth mentioning that different gauges may update at different intervals. Most will update at least once an hour while some may provide updates every 15 minutes. But none (that I know of) are providing data feedback in real time. Just above the selected chart will usually indicate the last time the data was updated.
CFS Reading
This reading tells you what the flow of the stream is. If the reading is 125cfs, it means that the flow is 125 cubic feet per second. A lot of anglers that really know a stream rely heavily on this number. However, the more casual angler may be easily deceived by this number as the “ideal flow” can vary significantly from stream to stream. The broader and sometimes flatter a streambed is, the more water flow it can comfortably accommodate.
So, 800cfs on a steep, narrow mountain stream may be a total blowout and not fishable at all. On a wider, flatter, low elevation mountain stream, 800cfs might be perfect. On a flat, 75-yard wide tailwater like the Clinch, 800cfs might be considered as a low flow. On a side note, I use generation schedules and data provided by TVA for local tailwater information.
Gauge Height Feet
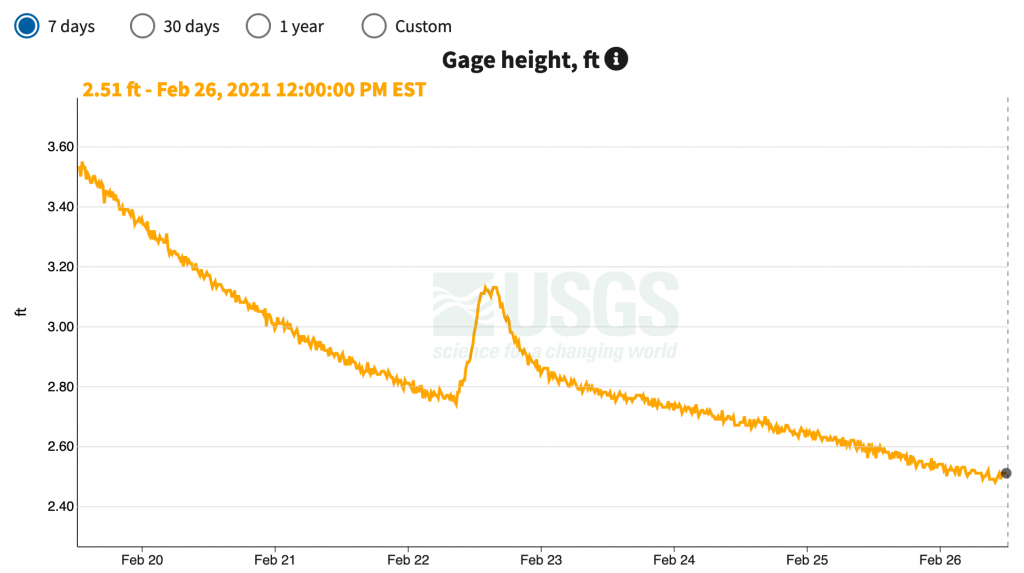
This reading tells you how high the water is on the gauge and gives you, I think, a little more “universal” reading. At least when it comes to mountain streams, about 2’ on that gauge is nearly always going to be close to “normal flow,” regardless of how wide or steep the stream is. For instance, the Oconaluftee is at a normal, near perfect level when it is at 2’ but may be flowing at around 550cfs. Little River is also normal and near perfect at 2’ but may be flowing at around 200cfs.
Again, there are a lot of variables like stream size and gradient but typically, in most Smoky Mountain streams, 2.5’ is the high side of good. In other words it is still wadeable in most of the usual spots but more difficult. When you reach 3’ on the gauge, you might still find some wadeable spots in isolated areas of small streams but pickings will be really slim. If you don’t know the water really well, don’t mess around with this. Beyond 3’, you’re likely just looking at a blown out river!
Water Temperature
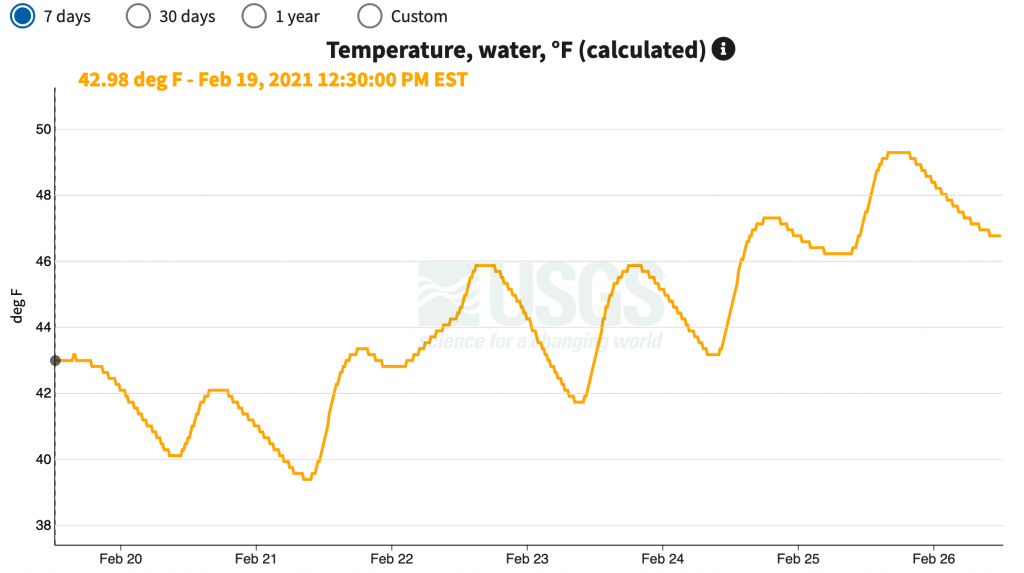
You won’t find this feature on every gauge, but some will have it. It’s a nice feature but you have to keep in mind that it’s reading temperature where the gauge is and water temperature will change significantly as you gain elevation on a stream. For example, the Little River gauge is located in Townsend at about 1100’ in elevation. If you’re going to fish Little River around Elkmont Campground, your elevation will be around 2300’. That coupled with more stream canopy, means your water temperature at Elkmont should be considerably cooler than the gauge reading at Townsend.
It’s not an exact science but as a general rule, you drop about 4-degrees water temperature for every 1000’ you gain in elevation. So, if the stream gauge for Little River reads 62-degrees, the water temperature at Elmont should be closer to 58-degrees. This can make an enormous difference when you’re trying to find feeding trout.
Rob, this is a great article. Thank you for writing it. I have looked at gauges for several years and struggle determing if a stream is in good shape for fishing. I guess the best way is to look at the big picture to see what the norm is compared to current conditions. Also, I asked Tim Guilfoile to reprint this in the nkff newsletter. Hope that’s ok.
Thanks for the nice feedback, Mark. No problem at all putting it in the NKFF newsletter!
We always give you full credit Rob and invariably I reprint something of yours in “The Creel”, the monthly newsletter of Northern Kentucky Fly Fishers. Your articles always get rave reviews.
You can see our newsletters at: https://nkff.org/
Thanks, Tim. You’re always welcome to use them.